
Fostering Insights with Exploratory
Data Visualization
Discovering data patterns through graphical and visual representations.
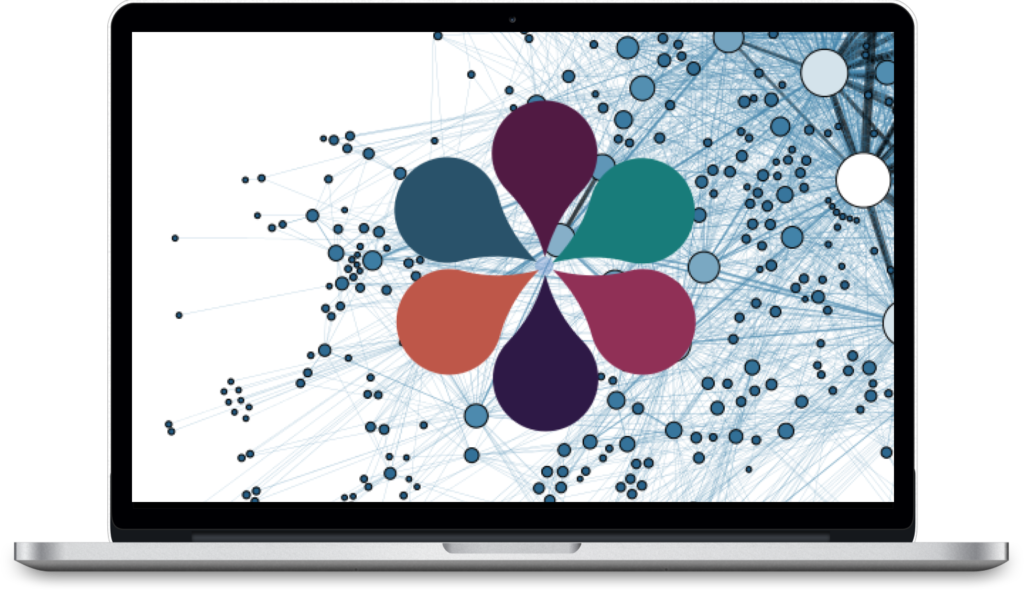
Data Visualization & Data Analysis
Infographic Design & UX Design
UX Research & Strategic Design
Concept Planning & User Analysis
OVERVIEW
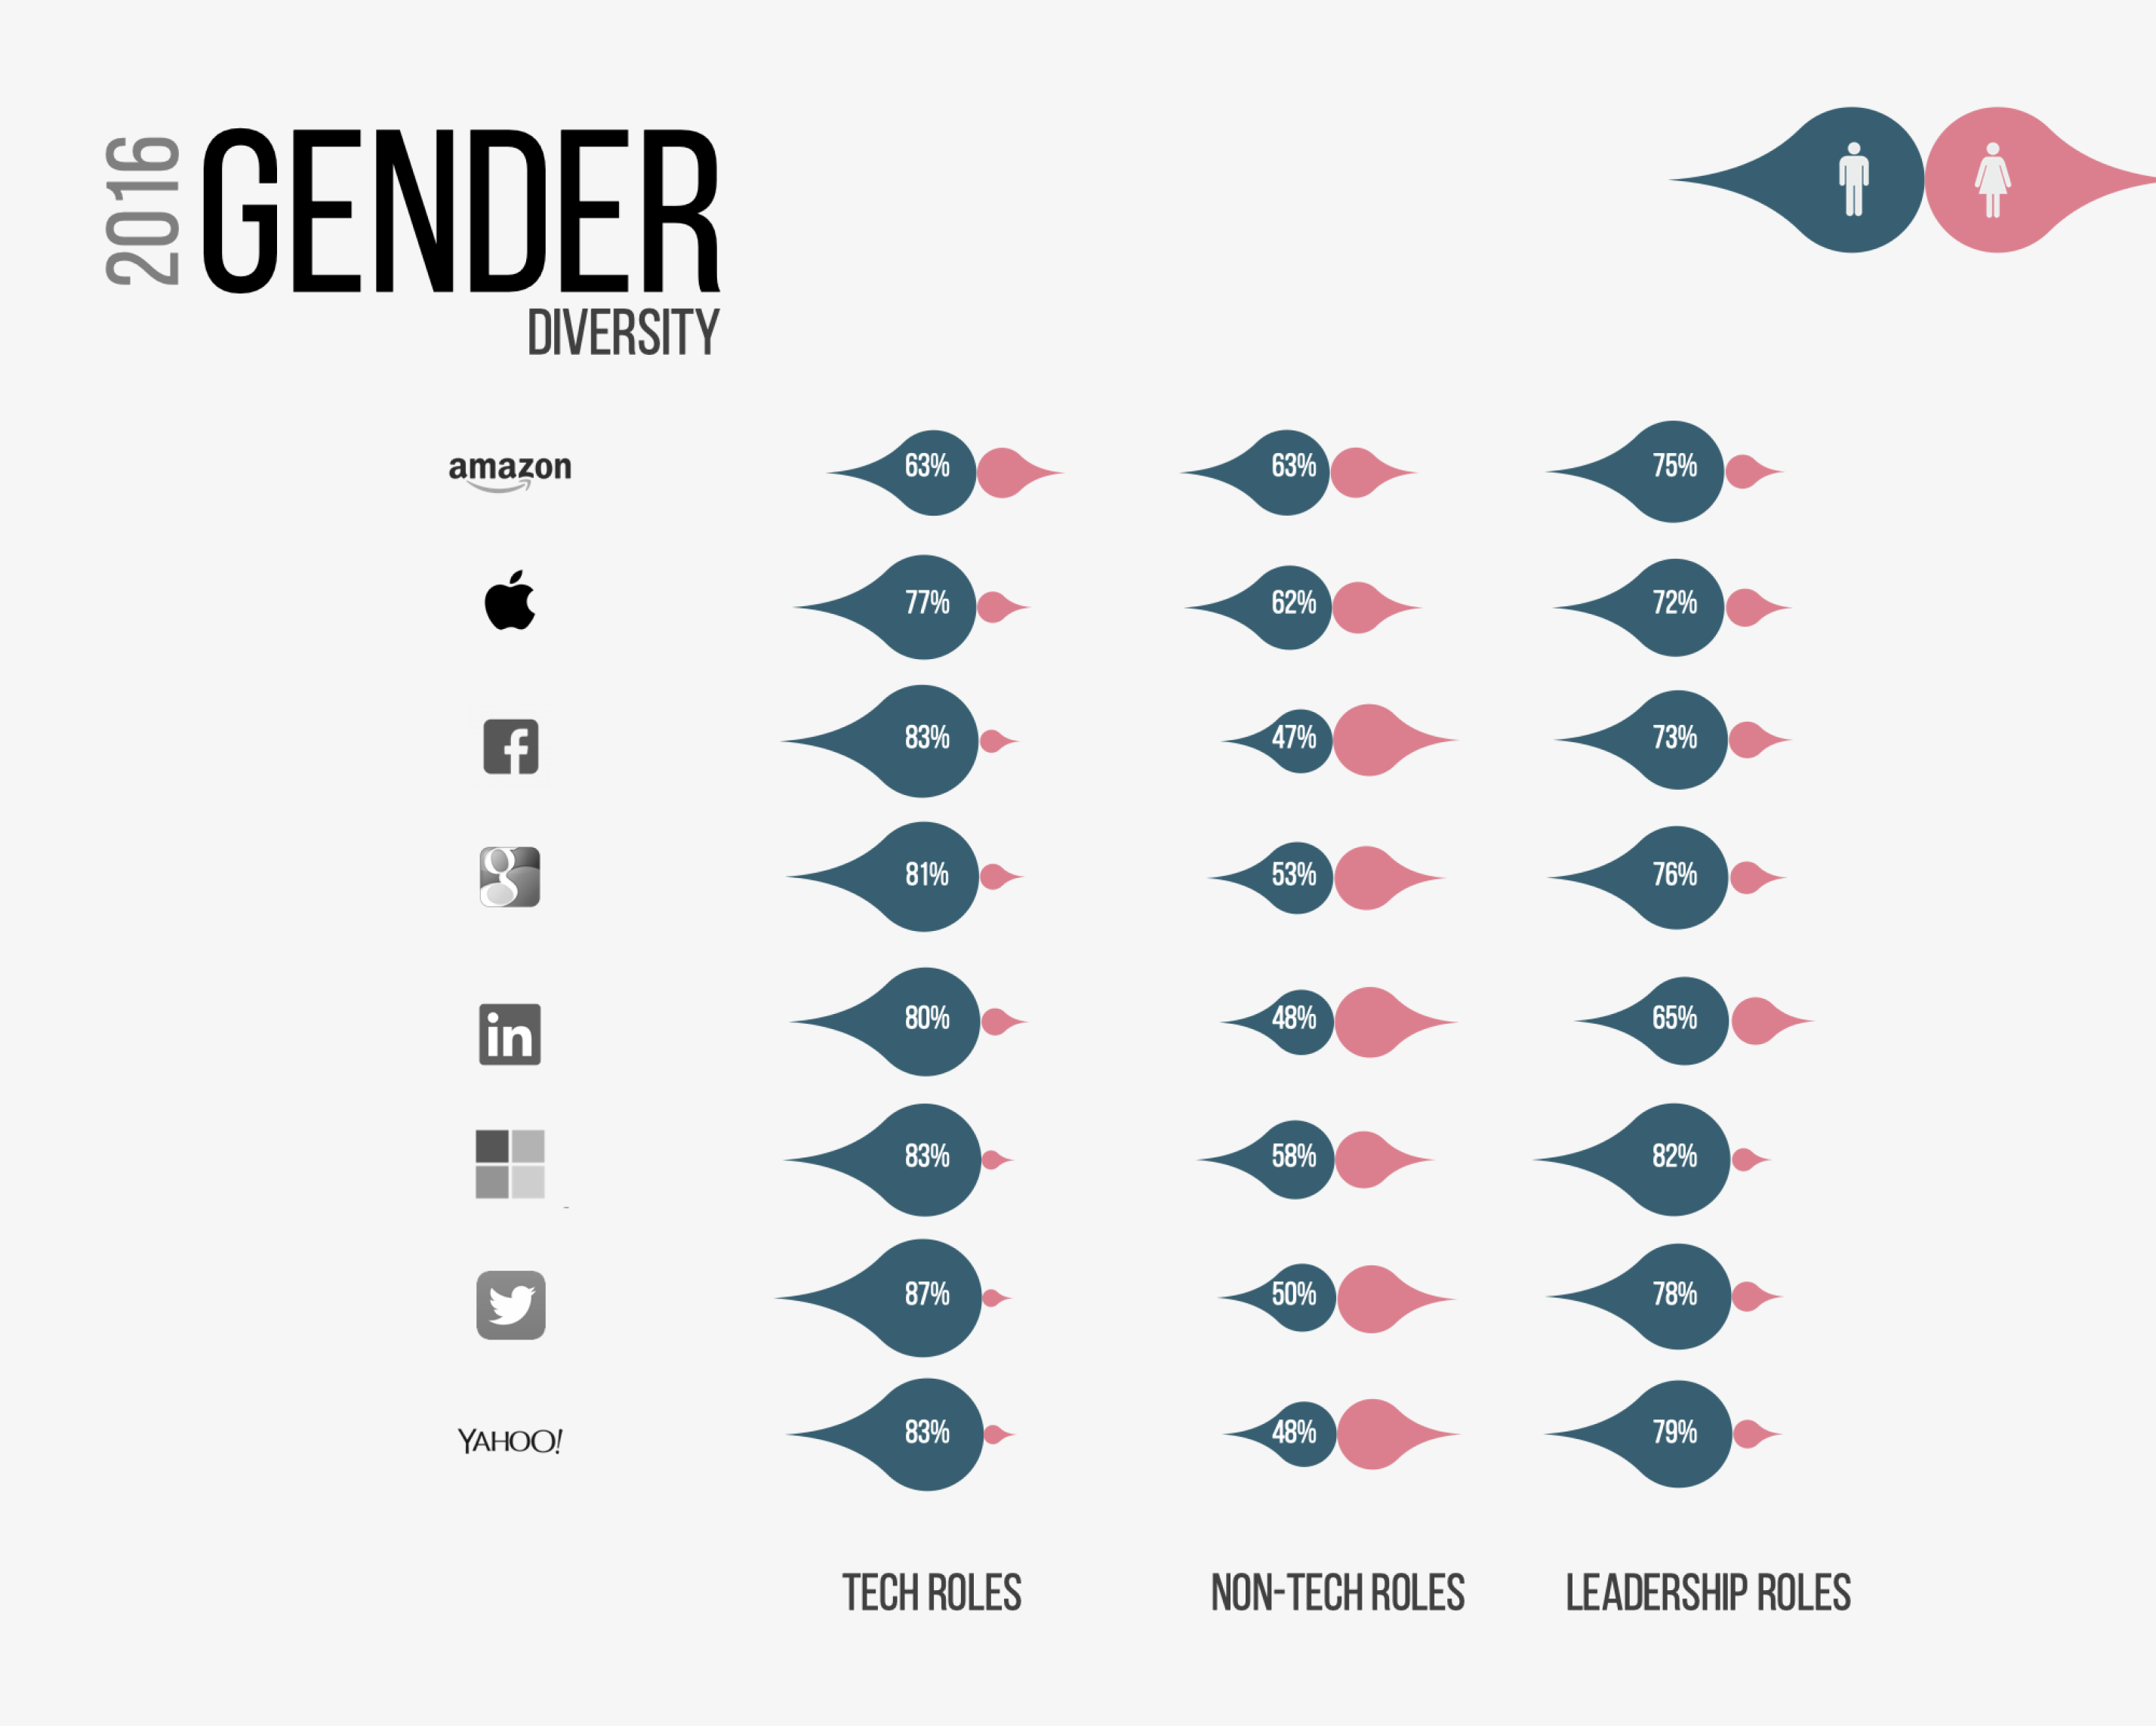
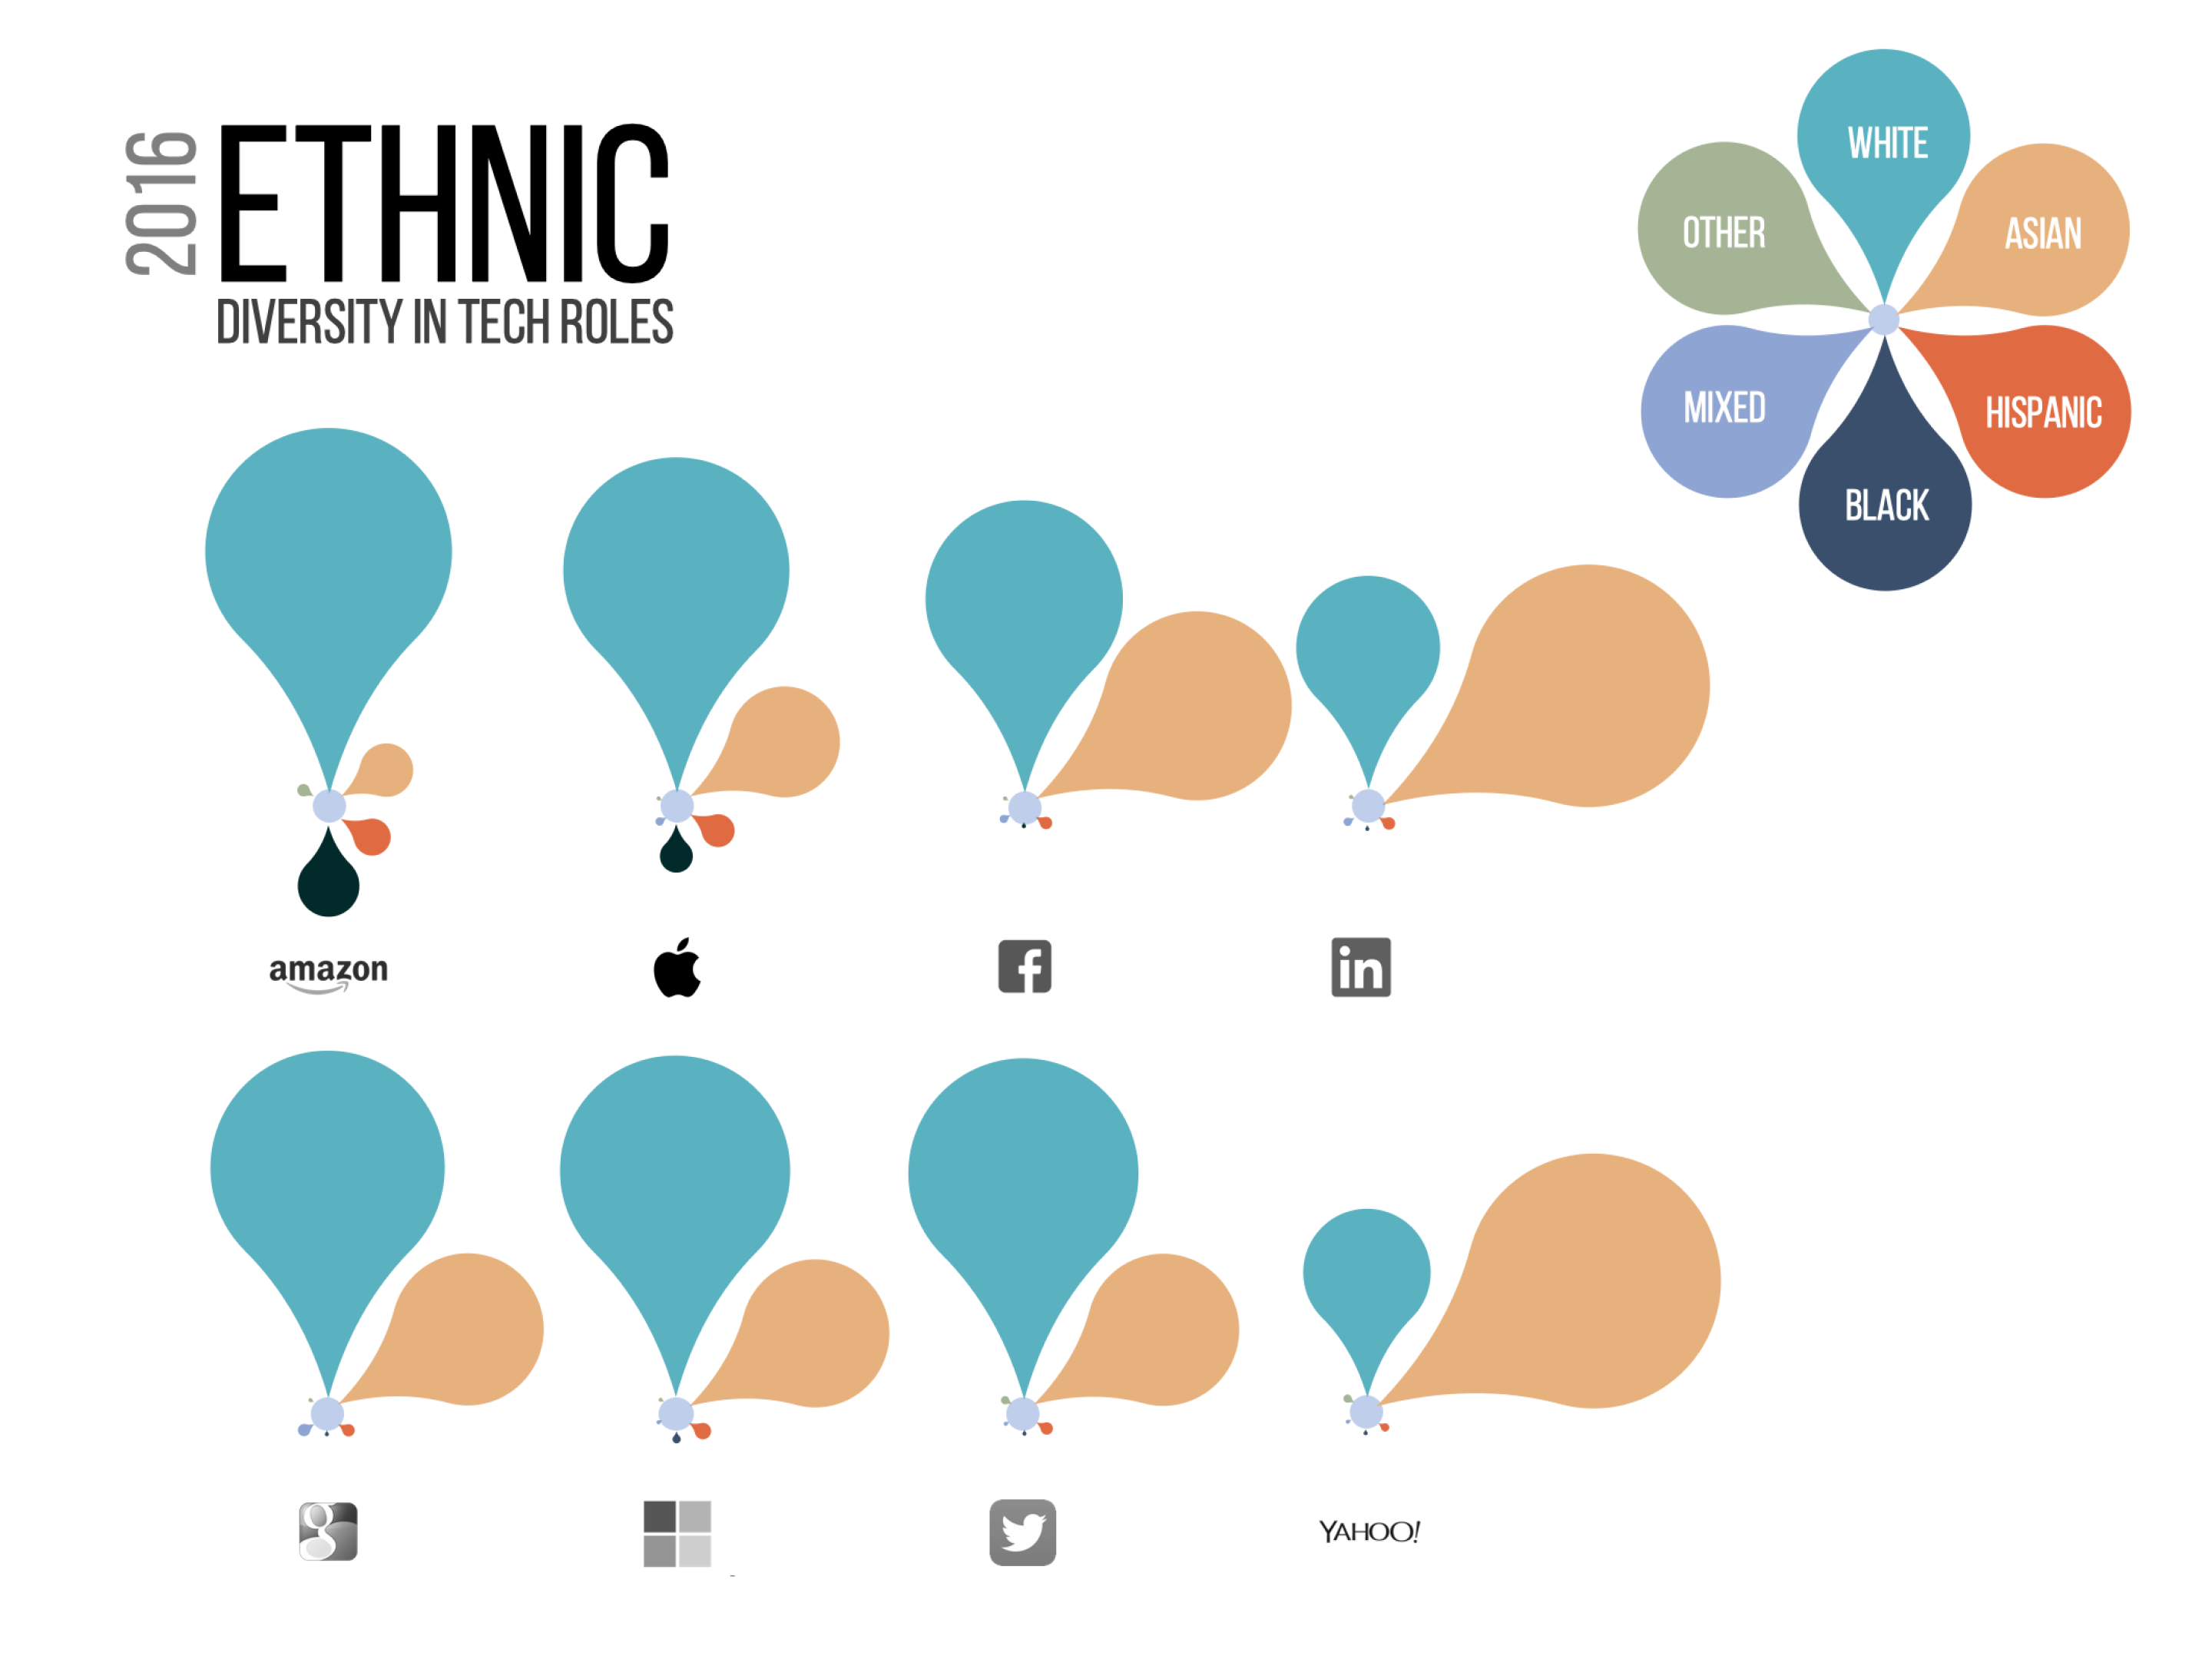
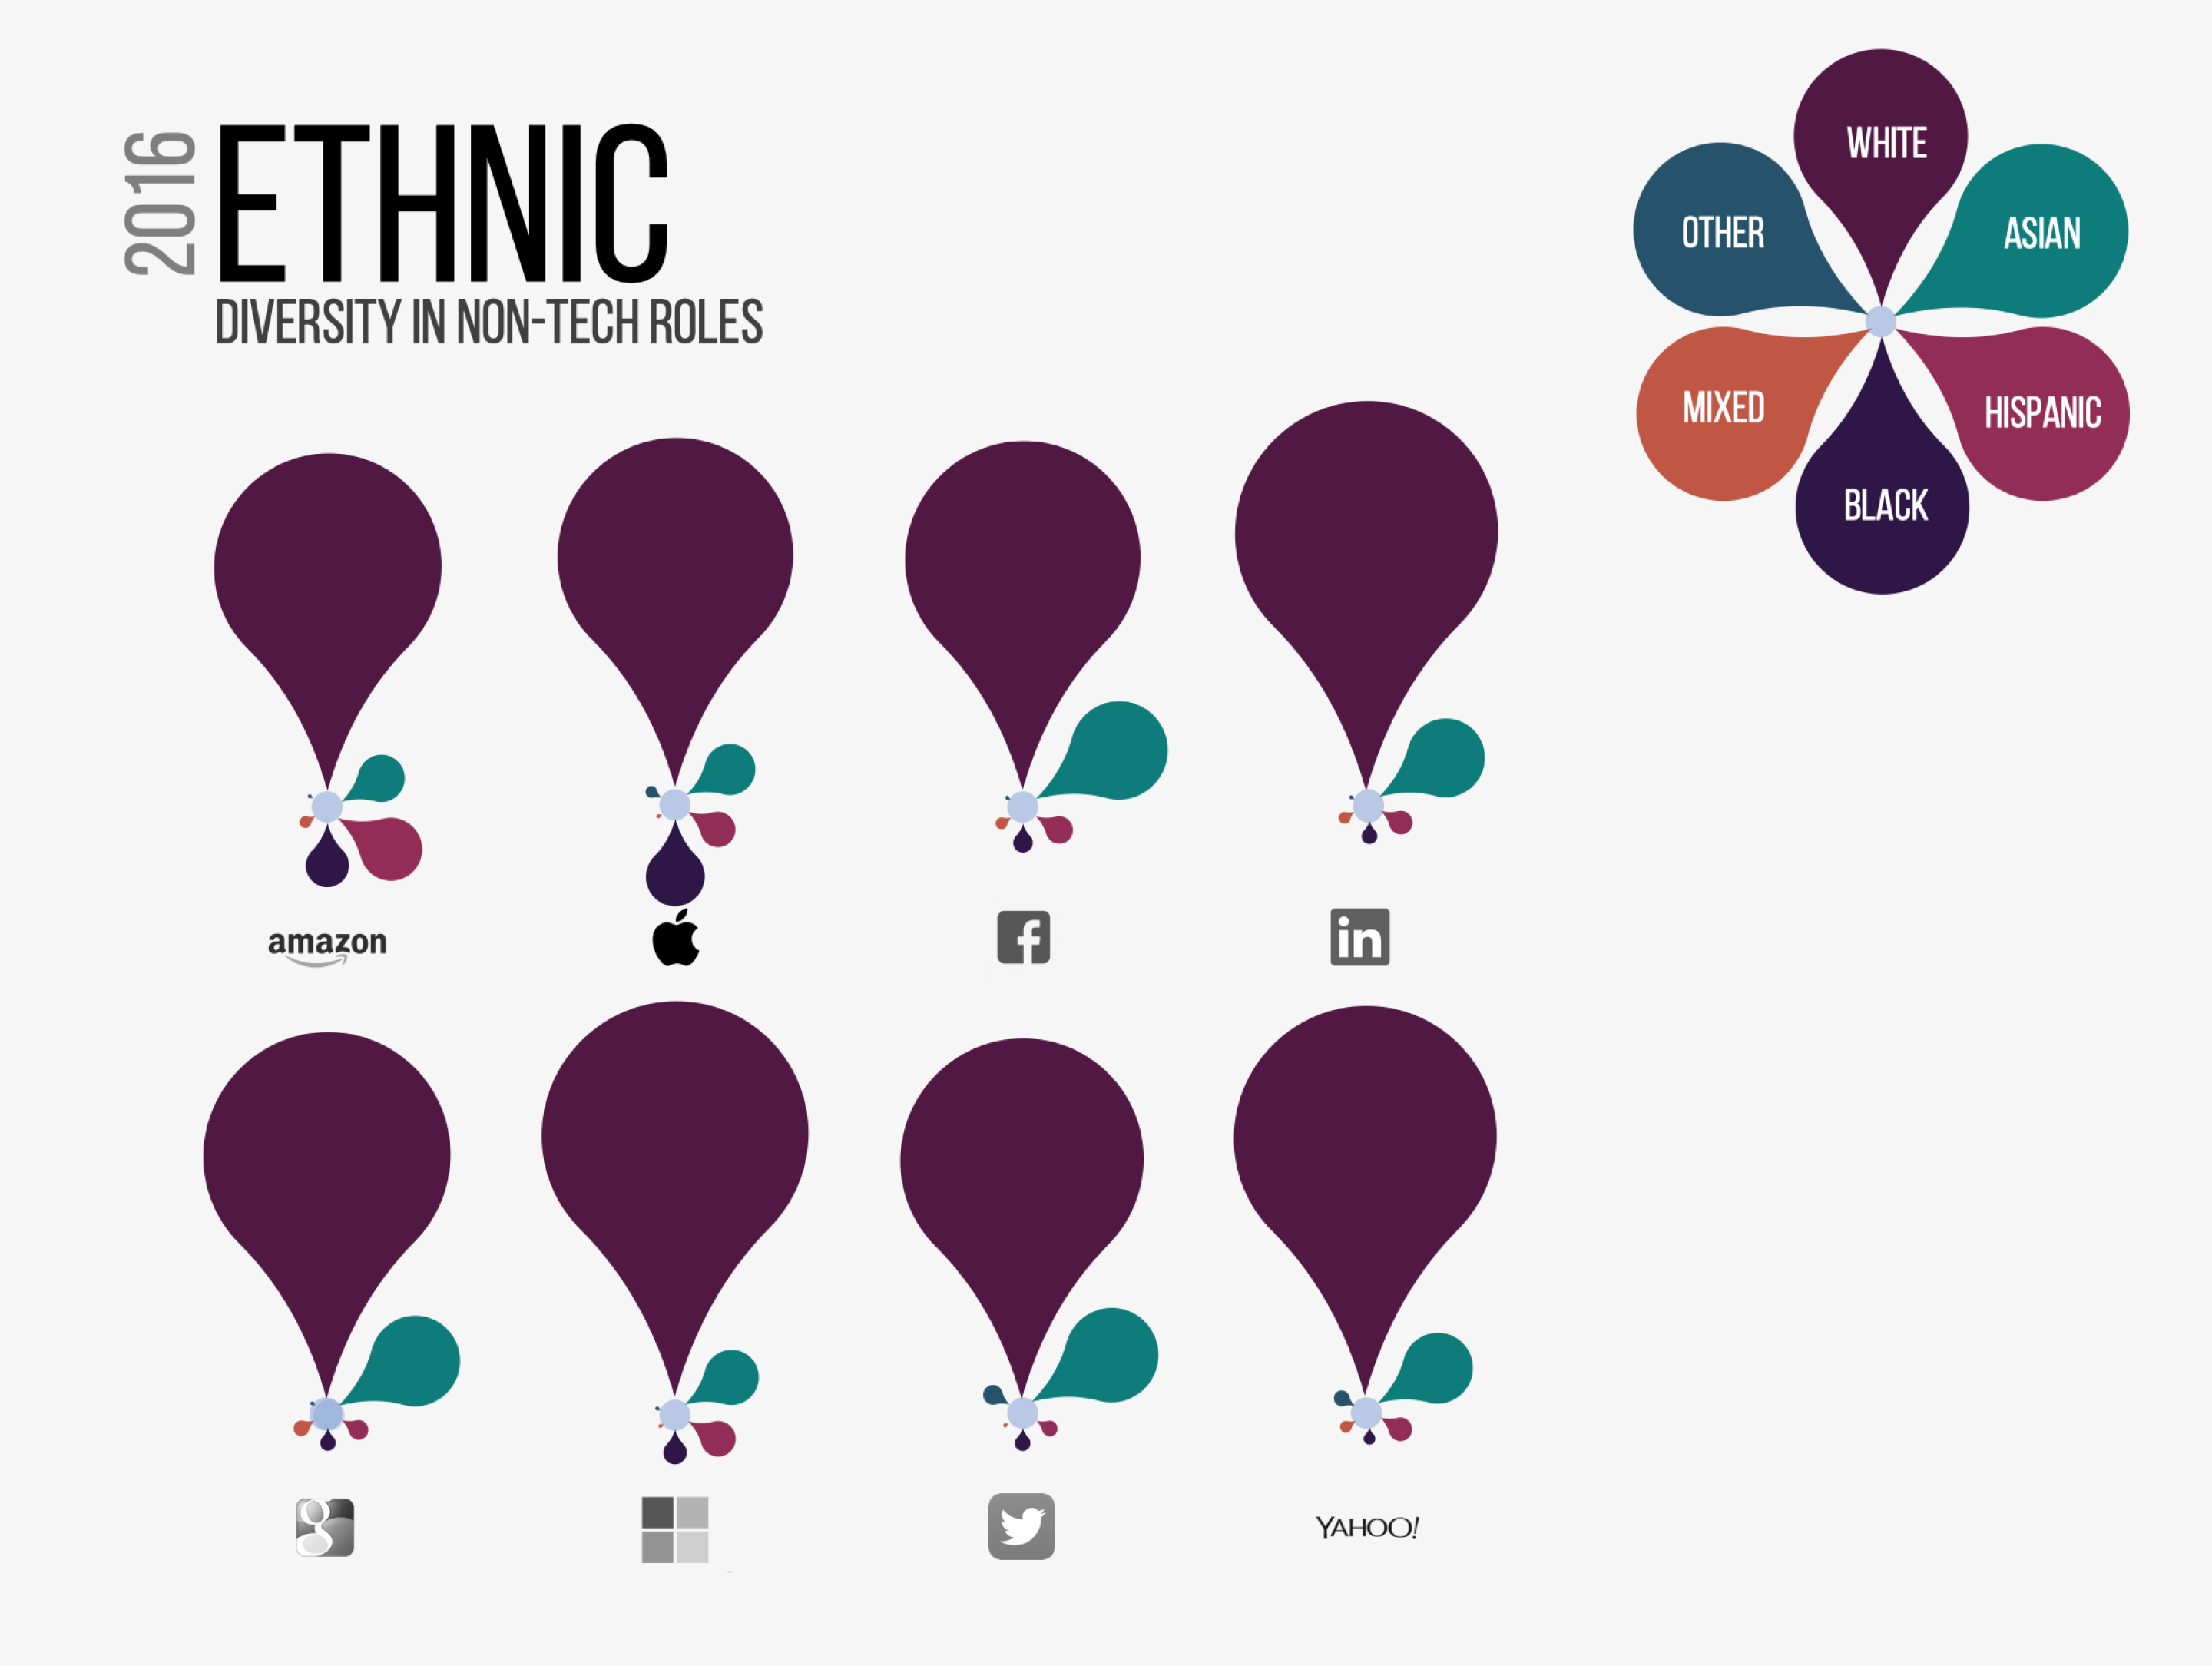
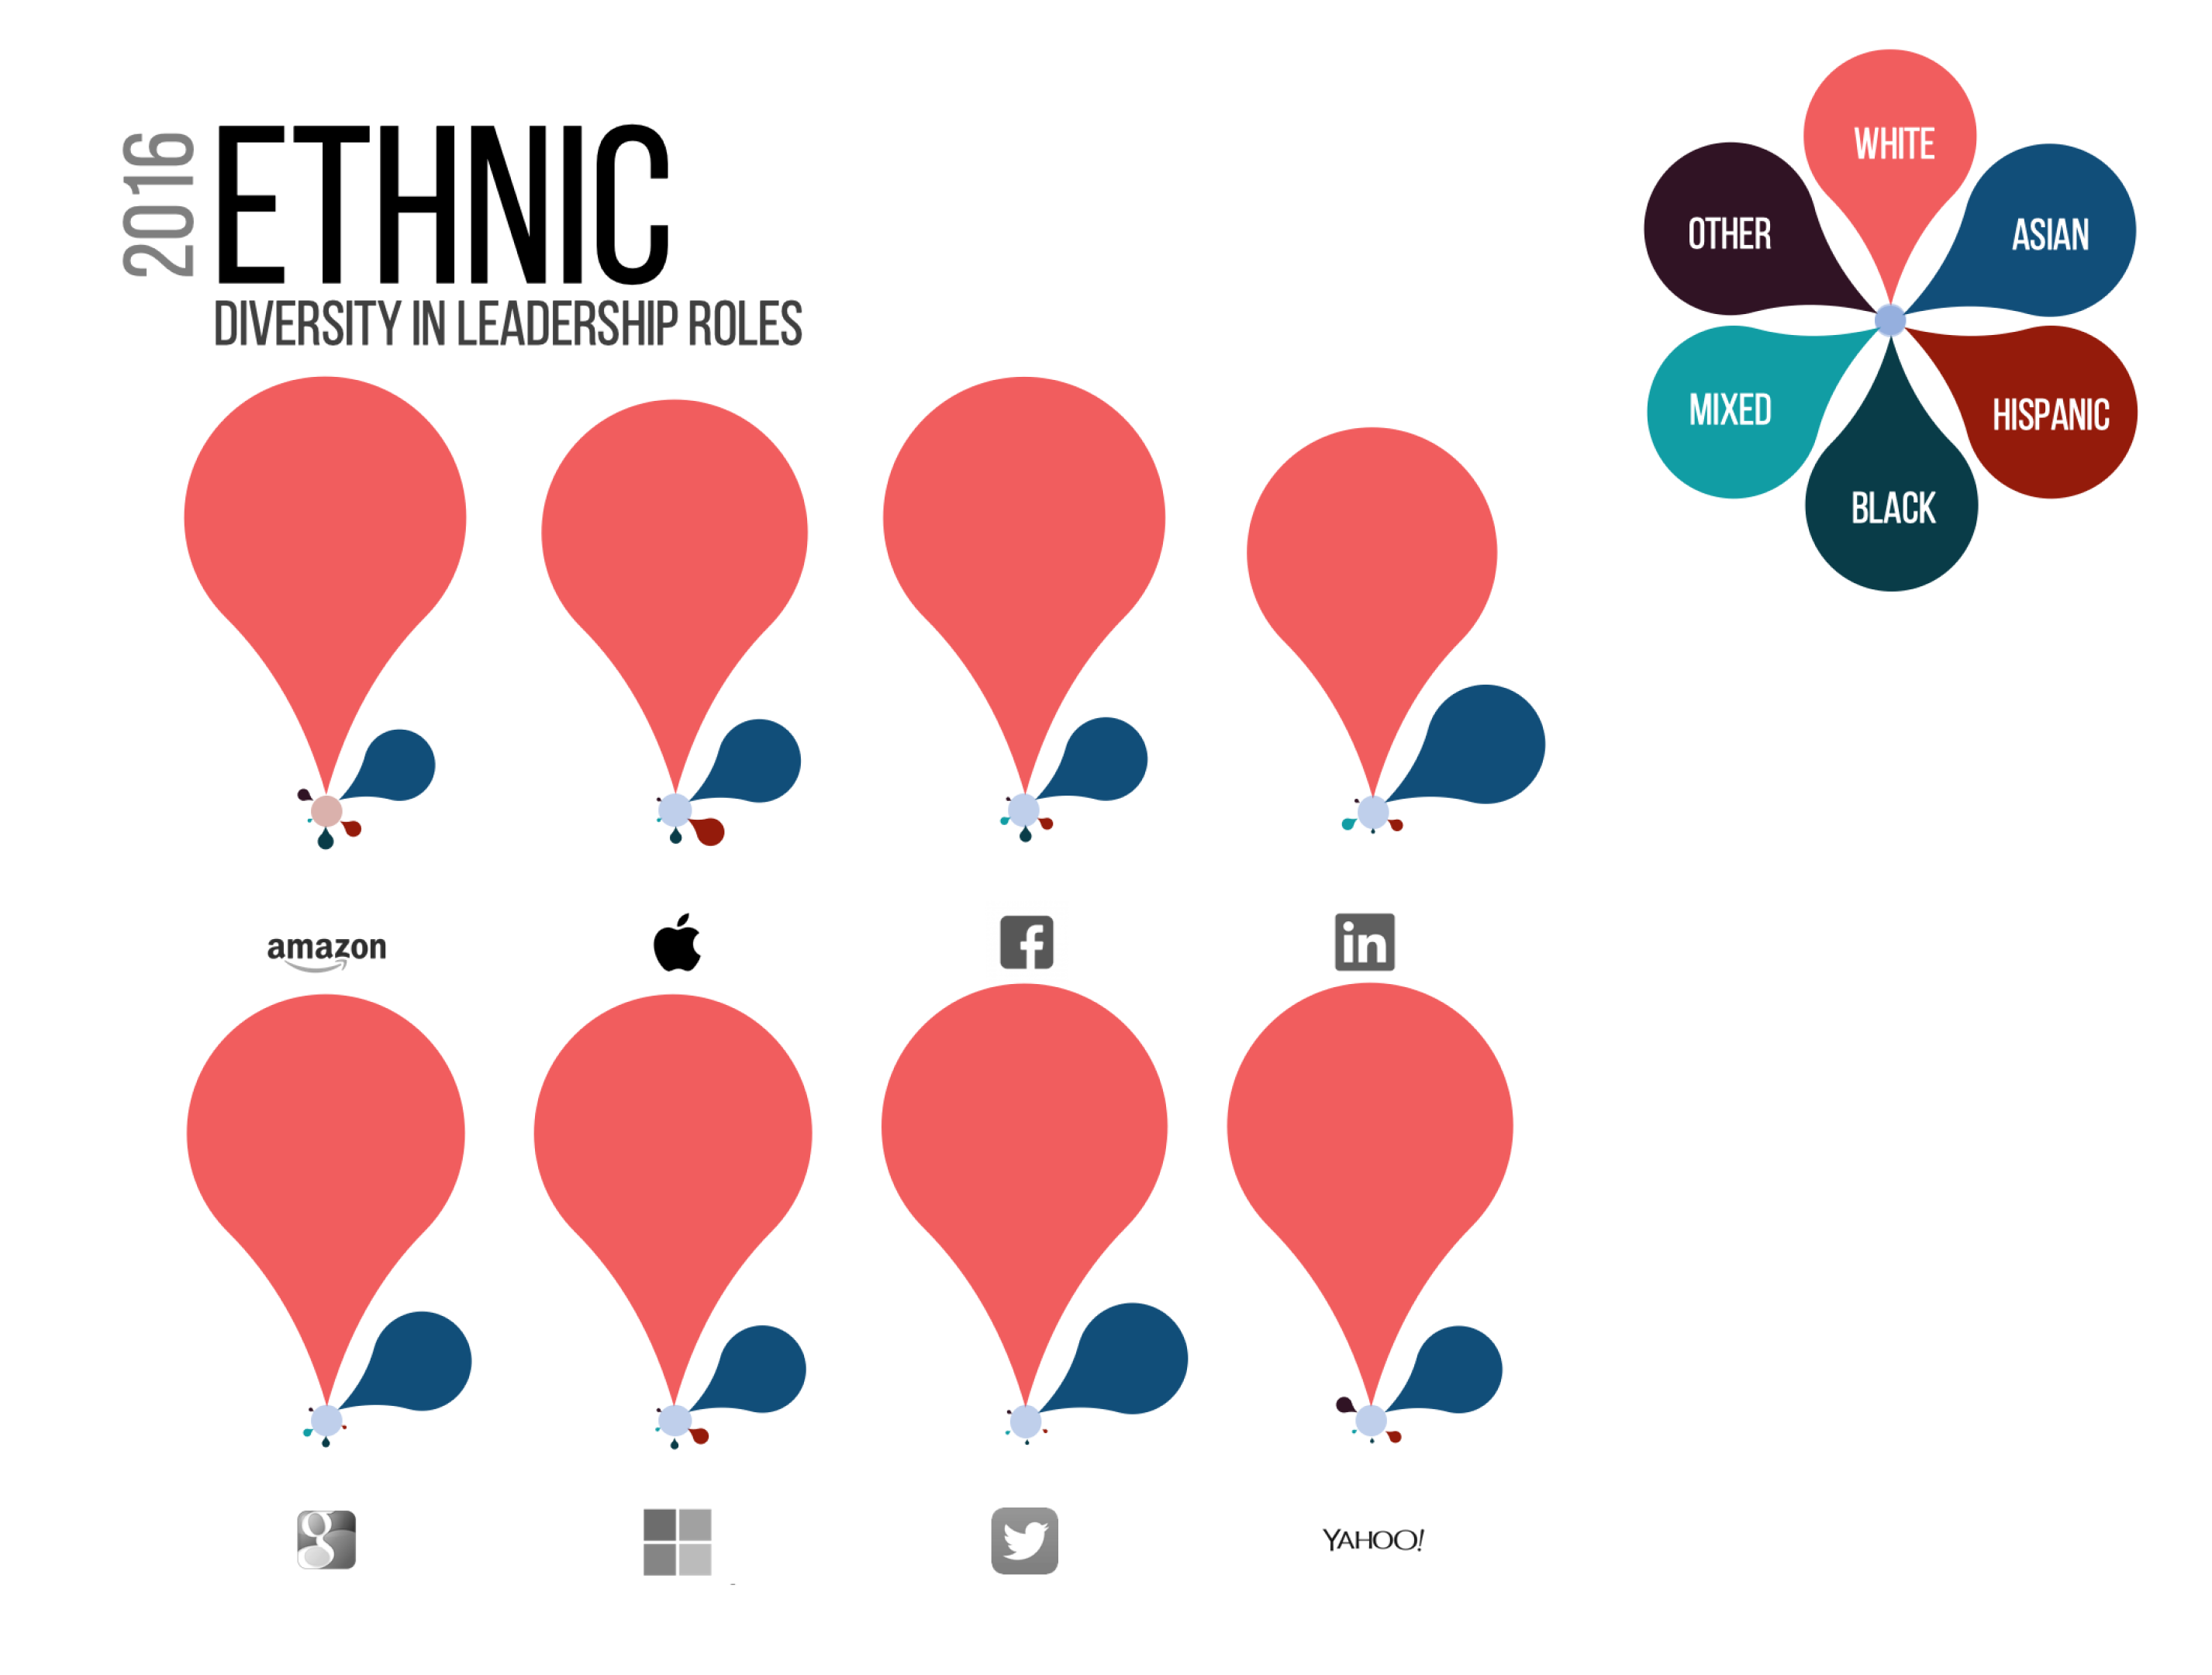
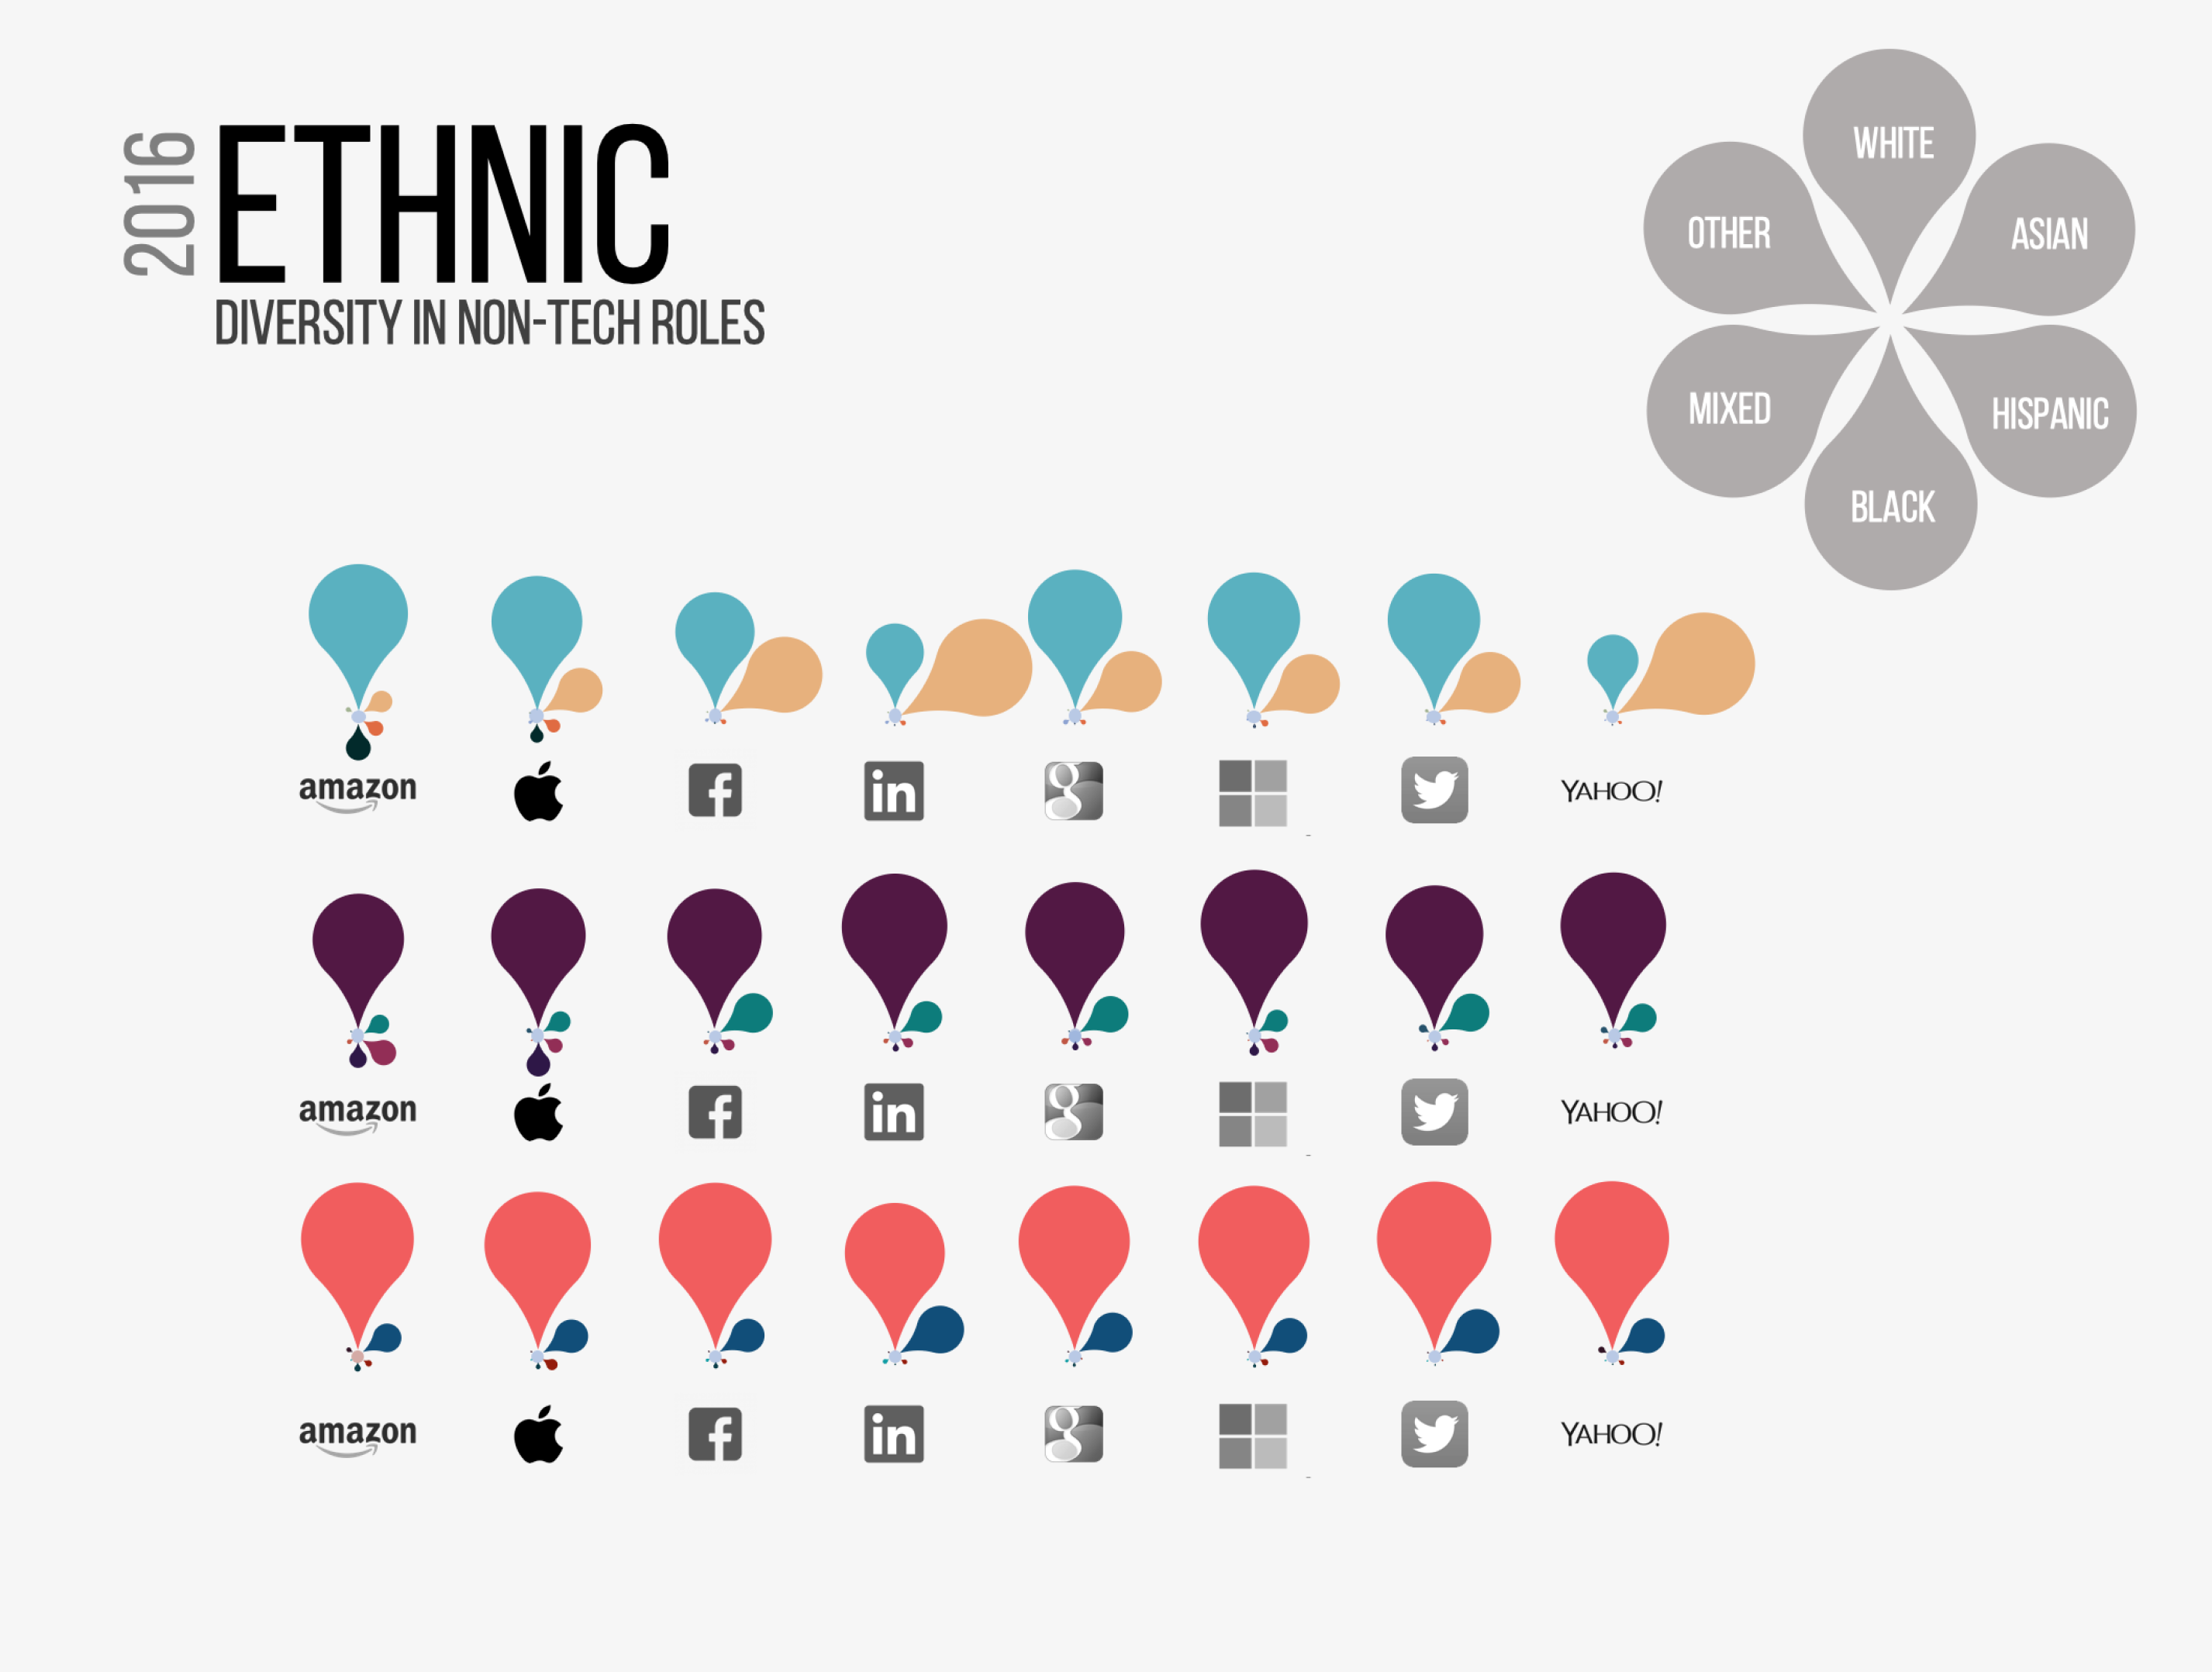
Project Title: 2016 Diversity in Tech
2016 Employment Data of Top Tech Companies: Amazon, Apple, Facebook, Google, Linkedin, Microsoft, Twitter, Yahoo
Description: This project interprets the 2016 employment data of the top 8 tech companies based on gender and ethnicity. Through exploratory and explanatory data visualization methods, graphical patterns emerged providing valuable data insights on gender and ethnic diversity of the 2016 top tech companies.
Data Source:
https://pxlnv.com/blog/diversity-of-tech-companies-by-the-numbers-2016/
Build. Create. Share.
LET’S COLLABORATE!
Whether you are working on a new startup or an existing product, I'd love to hear from you.
Please feel free to drop a line.
DROP ME A LINE.
![]()
designed + built by toti
san francisco, ca
copyright 2020
all rights reserved
![]()